Error in EvalFnOnAgentDist_AllStats_FHorz_Case1_PType

I got an error when running EvalFnOnAgentDist_AllStats_FHorz_Case1_PType with conditional restrictions. If I set

 simoptions.whichstats = [1,1,1,0,0,0,0];

then all is good. If I add the Lorenz and Gini with

 simoptions.whichstats = [1,1,1,1,0,0,0];

then I get an error in this line of code

AllStats=EvalFnOnAgentDist_AllStats_FHorz_Case1_PType(StatDist,Policy,FnsToEval,Params,n_d,n_a,n_z,N_j,N_i,d_grid,a_grid,z_grid_J,simoptions);

and this is the error message:

Unrecognized field name "LorenzCurveComment".

Error in EvalFnOnAgentDist_AllStats_FHorz_Case1_PType (line 518)
                    AllStats.(CondlRestnFnNames{rr}).(FnsToEvalNames{ff}).(allstatnames{aa})=tempStatsRestricted.(allstatnames{aa});
                                                                                             ^^^^^^^^^^^^^^^^^^^^^^^^^^^^^^^^^^^^^^
Error in main (line 300)
AllStats=EvalFnOnAgentDist_AllStats_FHorz_Case1_PType(StatDist,Policy,FnsToEval,Params,n_d,n_a,n_z,N_j,N_i,d_grid,a_grid,z_grid_J,simoptions);
         ^^^^^^^^^^^^^^^^^^^^^^^^^^^^^^^^^^^^^^^^^^^^^^^^^^^^^^^^^^^^^^^^^^^^^^^^^^^^^^^^^^^^^^^^^^^^^^^^^^^^^^^^^^^^^^^^^^^^^^^^^^^^^^^^^^^^
 

Interestingly, if I request the Lorenz with simoptions.whichstats = [1,1,1,1,0,0,0]; but I don’t have conditional restrictions, then all is good. So the problem seems to be the combo of conditional restrictions with Lorenz and Gini.

EDIT
Actually there seems to be a more serious problem, namely the calculations based on conditional restrictions seem to be wrong even for the conditional averages. I will report back later.

1 Like

with conditional restrictions is not consistent with life cycle profiles with conditional restrictions.

I realized this bug because I was plotting the life cycle profile of assets conditional on health status. It turns out that assets given good health are higher than assets given bad health for all ages, as expected. However, when I compute average assets given health status in the entire distribution, given by EvalFnOnAgentDist_AllStats_FHorz_Case1_PType I get the opposite result

Ok, it was a bit of work but I managed to create a MWE so that it is easy to realize where the bug is.

The MWE is available on my github: IntroToLifeCycleModels/ALE/AleModel24.m at main · aledinola/IntroToLifeCycleModels · GitHub

I have modified the orginal example “Life-Cycle Model 24: Using Permanent Type to model fixed-effects” by making very few changes:

  1. Added a second z shock which is age-dependent and that I interpret as a health shock. The probability of getting sick (or remaining sick) increases with age.
  2. I reduced the number of PT from 5 to 2, also cut number of grid points for labor supply. These are minor changes just to speed up the code.

I compute the life-cycle profiles of assets conditional on health: z2=0 (sick) vs z2=1 (healthy). So first I set up these conditional restrictions in lines 209-213:

%--- Conditional restrictions. Must return either 0 or 1
condres.sick = @(h,aprime,a,z1,z2,e) (z2==0);
condres.healthy = @(h,aprime,a,z1,z2,e) (z2==1);
% Add additional field to simoptions
simoptions.conditionalrestrictions = condres;

Then I compute the life-cycle profiles conditional on health (see lines 217-220):

simoptions.whichstats = [1,1,0,0,0,0,0];
tic
AgeStats=LifeCycleProfiles_FHorz_Case1_PType(StatDist, Policy, FnsToEvaluate, Params,n_d,n_a,n_z,N_j,N_i,d_grid, a_grid, z_grid, simoptions);
toc

Finally I compute the moments conditional on health for the entire population in line 225:

AllStats=EvalFnOnAgentDist_AllStats_FHorz_Case1_PType(StatDist, Policy, FnsToEvaluate, Params,n_d,n_a,n_z,N_j,N_i,d_grid, a_grid, z_grid, simoptions);

I plot the life-cycle profiles for assets conditional on health status (stored in the struct AgeStats):

figure
plot(1:1:Params.J,AgeStats.sick.assets.Mean)
hold on
plot(1:1:Params.J,AgeStats.assets.Mean)
hold on
plot(1:1:Params.J,AgeStats.healthy.assets.Mean)
hold off
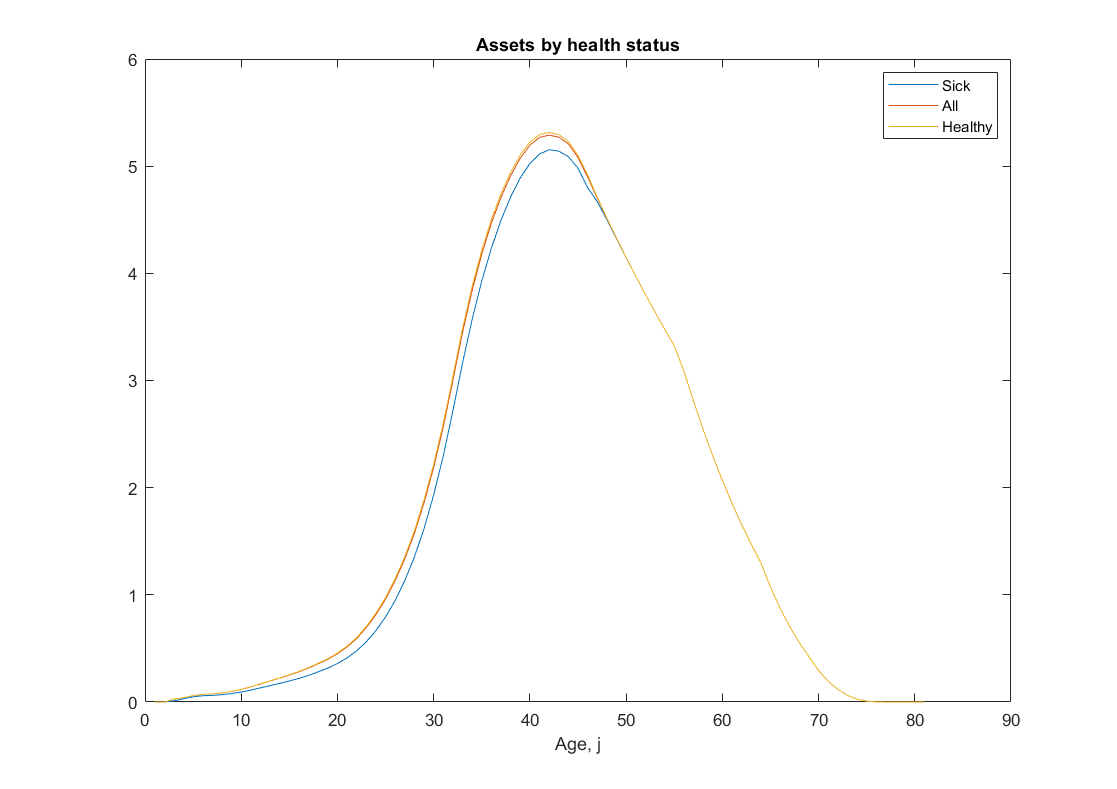
title('Assets by health status')
xlabel('Age, j')
legend('Sick','All','Healthy')

The figure is shown here:


You can see that assets conditional on sick are always lower than assets conditional on healthy, for every age j.

Finally, I show the conditional averages of assets by health obtained in AllStats as follows

ave_by_health.assets = [AllStats.sick.assets.Mean,...
                          AllStats.assets.Mean,...
                          AllStats.healthy.assets.Mean];
disp('THIS IS NOT CONSISTENT WITH THE ASSETS GRAPH!!!!')
fprintf('Average assets <sick>    = %f \n',ave_by_health.assets(1))
fprintf('Average assets <all>     = %f \n',ave_by_health.assets(2))
fprintf('Average assets <healthy> = %f \n',ave_by_health.assets(3))

The result is:

Average assets <sick>    = 2.652637 
Average assets <all>     = 2.040498 
Average assets <healthy> = 1.961682 

which is not consistent with the graph: here it seems that sick people hold more assets than healthy, while the opposite was true in the plot based on AgeStats!

@robertdkirkby I would be really grateful if you could look into this potential bug. I suspect that LifeCycleProfiles_FHorz_Case1_PType is OK but there is some bug in EvalFnOnAgentDist_AllStats_FHorz_Case1_PType.
Thank you so much!

EDIT
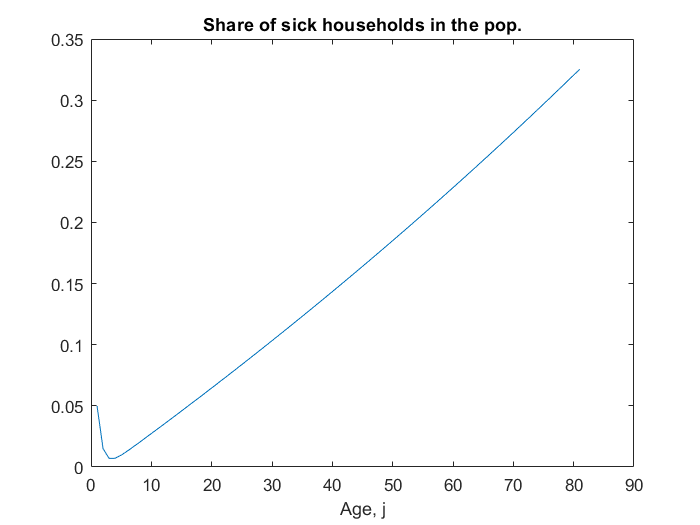
I also show the share of sick (with z2=0) households in the population, by age, in the figure below:


There is a positive correlation between age and sick: older people are more likely to be sick. This might explain why average assets conditional on sick are higher, even though average assets conditional on sick and on age are lower.

1 Like

This is very much on my to-do list, but is a decent size job. Hopefully get to it on Friday, otherwise will be first thing next week. Sorry to take so long, I have some code with co-authors that needs to be done this week and is keeping my computer runtime all used up.

1 Like

Thank you Robert, take your time! Actually I am not so sure about the second bug (what I call a more serious problem in my OP), it could be that the toolkit results are correct, after all, and it was me not understanding them :thinking:.

First:

Unrecognized field name "LorenzCurveComment".

Error in EvalFnOnAgentDist_AllStats_FHorz_Case1_PType

I never get this, and Ctrl+F for LorenzCurveComm in the file EvalFnOnAgentDist_AllStats_FHorz_Case1_PType does not find anything. Guessing that your version was just not fully updated?

I also found one error, namely you couldn’t use conditional restrictions in AllStats using parameters that differ by ptype (not related to your posts, just something I ran into while there). Fixed this while I was there.

I ran the some tests by adding the following to the end of LifeCycleModel24.m and they all worked fine.


%% Redo, this time with conditional restriction
simoptions.conditionalrestrictions.firsttwoptypes=@(h,aprime,a,z,e,alpha_i) alpha_i<1.1;
simoptions.conditionalrestrictions.evenages=@(h,aprime,a,z,e,agej) rem(agej,2)==0;

AllStats2=EvalFnOnAgentDist_AllStats_FHorz_Case1_PType(StationaryDist, Policy, FnsToEvaluate, Params,n_d,n_a,n_z,N_j,N_i,d_grid, a_grid, z_grid, simoptions);

%% Compare AllStats2 with AllStats and with LifeCycleProfiles

% Following all report the same
AllStats.alpha_i.Mean
AllStats2.evenages.alpha_i.Mean
AgeConditionalStats.alpha_i.Mean

% Following report the same
AllStats.assets.Mean
sum(AgeConditionalStats.assets.Mean.*Params.mewj)

% Following report the same
AllStats2.evenages.assets.Mean
sum(AgeConditionalStats.assets.Mean(2:2:end).*Params.mewj(2:2:end))./sum(Params.mewj(2:2:end))

Next I am going to take a closer look at the github repo you link.

1 Like

I added the following lines to the github repo you link (to the AleModel24.m).

%% Take a closer look at the assets numbers
% Following should be the same
AllStats.assets.Mean
Params.theta_dist(1).*AllStats.assets.ptype001.Mean+Params.theta_dist(2).*AllStats.assets.ptype002.Mean

AllStats.sick.assets.Mean
AllStats.healthy.assets.Mean
% Following should be the same
AllStats.assets.Mean
AllStats.share_sick.Mean.*AllStats.sick.assets.Mean + (1-AllStats.share_sick.Mean).*AllStats.healthy.assets.Mean

% Following should be the same
AllStats.assets.Mean
sum(AgeStats.assets.Mean.*Params.mewj)

% Following should be the same
AgeStats.assets.Mean
temp=AgeStats.share_sick.Mean.*AgeStats.sick.assets.Mean + (1-AgeStats.share_sick.Mean).*AgeStats.healthy.assets.Mean
AgeStats.assets.Mean-temp % all zeros, yes (they are 1e-15)

% Following should be the same
AllStats.sick.assets.Mean
sum(AgeStats.share_sick.Mean.*AgeStats.sick.assets.Mean.*Params.mewj)/sum(AgeStats.share_sick.Mean.*Params.mewj) % Note: mewj does not differ by sick/healthy
% Following should be the same
AllStats.healthy.assets.Mean
sum((1-AgeStats.share_sick.Mean).*AgeStats.healthy.assets.Mean.*Params.mewj)/sum((1-AgeStats.share_sick.Mean).*Params.mewj)

% Note: at first I thought the following should be the same
AllStats.sick.assets.Mean
sum(AgeStats.sick.assets.Mean.*Params.mewj)
% But this is incorrect, they should be different, because the 'mass of sick conditional on age' differs with age.

I think the toolkit is correct. The reason that the ‘assets conditional on age for sick’ relative to the ‘assets conditional on age for healthy’ don’t look at first glance like they ‘assets for sick’ relative to ‘assets for healthy’ is because of the differences in the relative masses of sick and healthy at each age.

When I was writing it I first did what is now the last few lines, and was suprised when they were not equal. I think these lines capture the same logic as why we would expect the ‘asset profile over age for healthy’ is higher should lead to ‘assets for healthy’ to be higher. But this is not true because of the way the masses of sick and healthy differ for age.

Another way to see this is to look at

plot(Params.agej, AgeStats.sick.assets.Mean,Params.agej,1-AgeStats.sick.assets.Mean)
legend('sick','healthy')

You can see that what happens in mid-late life matters more for sick, what happens early matters more for healthy. Looking at the age-profiles of assets conditional on health-status, we see healthy do have more assets than sick at younger ages, but more of the sick mass is at the medium-late ages where assets are higher.

As another check, look at assets of young conditional on health. Just adding simoptions.agegroupings=[1,30,60]
before calculating the AgeStats=LifeCycleProfiles_FHorz_Case1_PType()
we can see from AgeStats.sick.assets.Mean vs AgeStats.healthy.assets.Mean that healthy hold more assets at all ages, but from AgeStats.share_sick.Mean we see that the sick are more in the third age grouping than the first, and that this has higher assets.

In short, I think things are correct. Just that the plots of ‘conditional on age and on health’ are very subtle to interpret due to not being able to see how the mass of health status is changing over age.

[PS. had to fix something small in simoptions.agegroupings to get it to run]

1 Like

Thank you so much for your detailed explanation Robert!
I did not consider at first that age and health status are not independent.

1 Like

Now everything works, thanks again. I realized however that computing the age statistics with conditional restrictions and the Gini/Lorenz takes a huge amount of time. I report in the table below the running times (in seconds) on my laptop:

RUNNING TIMES FOR SUBPARTS OF PROGRAM:
Time for VFI: 10.645135
Time for Distr: 0.101593
Time for AgeStats: 118.649307
Time for AllStats: 1.249310

I was wondering if there is a way to speed up the calculation… not really a request, I’m pretty happy with what the toolkit does now and I can still compute these statistics (such as Lorenz curve) with homemade code.

EDIT
After a bit of profiling, the bottleneck is in StatsFromWeightedGrid, these lines:

CumSumSortedWeightedValues=cumsum(WeightedSortedValues);
                % Calculate the Lorenz curve
                % (note, we already eliminated the zero mass points, and dealt with case that the remaining grid is just one point)
                LorenzCurve=zeros(npoints,1);
                llvec=1/npoints:1/npoints:1;
                for ll=1:npoints-1 % Note: because there are npoints points in lorenz curve, avoiding a loop here can be prohibitive in terms of memory use
                    [~,lorenzcind]=max(CumSumSortedWeights >= llvec(ll));
                    if lorenzcind==1
                        LorenzCurve(ll)=llvec(ll)*SortedValues(lorenzcind);
                    else
                        LorenzCurve(ll)=CumSumSortedWeightedValues(lorenzcind-1)+(llvec(ll)-CumSumSortedWeights(lorenzcind-1))*SortedValues(lorenzcind);
                    end
                end
                LorenzCurve(npoints)=CumSumSortedWeightedValues(end);
                % Now normalize the curve so that they are fractions of the total.
                SumWeightedValues=sum(WeightedSortedValues);
                AllStats.LorenzCurve=LorenzCurve/SumWeightedValues;

Usually I compute the Lorenz curve and the Gini using this code:

function [relpop,relz,g] = mylorenz(val,pop)

% Add something to deal with zero mass points, NaN, etc.
assert(numel(pop) == numel(val), ...
    'gini expects two equally long vectors (%d ~= %d).', ...
    size(pop,1),size(val,1))

pop = [0;pop(:)]; val = [0;val(:)];     % pre-append a zero

isok = all(~isnan([pop,val]'))';        % filter out NaNs
pop = pop(isok); val = val(isok);

z = val.*pop;
[~,ord] = sort(val);
pop     = pop(ord);     
z       = z(ord);
pop     = cumsum(pop);  
z       = cumsum(z);
relpop  = pop/pop(end); 
relz    = z/z(end);

% From here you can compute the Gini easily...
g = 1 - sum((relz(1:end-1)+relz(2:end)) .* diff(relpop));

end

Your code is slower because you want to compute the Lorenz curve for exactly npoints, so you have an expensive loop over ll from 1 to npoints-1, which is difficult to vectorize for memory limitations. But why do you want the Lorenz curve on exactly npoints?

With my code, the coordinates of the Lorenz curve are given by [relpop,relz] and each is a vector with number of elements equal to the total number of points for the states, i.e.

prod([n_a,n_z(1),n_z(2),n_e,N_i,N_j])

Faster now :slight_smile:

You can set simoptions.whichstats=[1,1,1,2,1,2,1], and it uses faster (but more memory) intensive ways to compute the quantiles and lorenz curve (the 4th and 6th elements, respectively; less loops, more vectorization).

I also changed it so that while AllStats still defaults to simoptions.whichstats=ones(7,1), LifeCycleProfiles defaults to simoptions.whichstats=[1,1,1,2,1,2,1]. I figure this is a good compromise: when you are conditional on age there are less points and can probably afford to use the faster-higher-memory approach, while for AllStats things are much bigger and you only do a single calculation so a slower-less-memory approach is suitable to avoid throwing out-of-memory errors.

[note: the shape of simoptions.whichstats is irrelevant, can be column or row vector]

Overhauling the lorenz curve to add the simoptions.whichstats(6)=2 version has been on my to-do list so figured I’d get on and do it since you ask. simoptions.whichstats(4)=2 was done a while back, only change there is it is now the default for LifeCycleProfiles.

As for why do I put LorenzCurve onto exactly npoints? I think it just makes it much easier for user to understand what it is and the form it takes if it always comes out the exact same way. And Lorenz curves are much easier to ‘read’ when you have the points evenly spaced. It’s true you can calculate and store the info faster if you don’t use evenly spaced points, but I do think that makes it less beginner friendly. [You can set simoptions.npoints to something else if you have a reason for wanting more.]

PS. Out of interest, what does your AgeStats time fall to now?

1 Like

Fantastic, thanks!
I’m using a different and faster computer at home now, so to compare apples with apples:

This should be the run time before your change, imposing simoptions.whichstats=[1,1,1,1,0,0,0]

RUNNING TIMES FOR SUBPARTS OF PROGRAM:
simoptions.whichstats = 
     1     1     1     1     0     0     0

Time for VFI: 2.493074 
Time for Distr: 0.078209 
Time for AgeStats: 66.495271 
Time for AllStats: 1.008142 

But if I set simoptions.whichstats=[1,1,1,2,0,0,0]

then I get an error:

Error using gpuArray/interp1
Interpolation requires at least two sample points in each dimension.

Error in StatsFromWeightedGrid (line 154)
                    temp=interp1(CumSumSortedWeights2,CumSumSortedWeightedValues(u1index),llvec(1:end-1));
                         ^^^^^^^^^^^^^^^^^^^^^^^^^^^^^^^^^^^^^^^^^^^^^^^^^^^^^^^^^^^^^^^^^^^^^^^^^^^^^^^^
Error in EvalFnOnAgentDist_AllStats_FHorz_Case1_PType (line 431)
                    AllStats.(CondlRestnFnNames{rr}).(FnsToEvalNames{ff}).(Names_i{ii})=StatsFromWeightedGrid(SortedValues,RestrictedSortedWeights,simoptions.npoints,simoptions.nquantiles,simoptions.tolerance,1,simoptions.whichstats); % 1 is presorted
                                                                                        ^^^^^^^^^^^^^^^^^^^^^^^^^^^^^^^^^^^^^^^^^^^^^^^^^^^^^^^^^^^^^^^^^^^^^^^^^^^^^^^^^^^^^^^^^^^^^^^^^^^^^^^^^^^^^^^^^^^^^^^^^^^^^^^^^^^^^^^^^^^^^^^^^
Error in AleModel24 (line 243)
AllStats=EvalFnOnAgentDist_AllStats_FHorz_Case1_PType(StatDist, Policy, FnsToEvaluate, Params,n_d,n_a,n_z,N_j,N_i,d_grid, a_grid, z_grid, simoptions);
         ^^^^^^^^^^^^^^^^^^^^^^^^^^^^^^^^^^^^^^^^^^^^^^^^^^^^^^^^^^^^^^^^^^^^^^^^^^^^^^^^^^^^^^^^^^^^^^^^^^^^^^^^^^^^^^^^^^^^^^^^^^^^^^^^^^^^^^^^^^^^

You can find the updated code in the same repo, if you wanna reproduce the error

If instead I do not set simoptions.agestats, the code runs OK and gives

Time for VFI: 2.605614 
Time for Distr: 0.087549 
Time for AgeStats: 18.301148 
Time for AllStats: 1.223809

I can’t see what simoptions.whichstats is equal to since it is set internally (I could see it if was debugging the code).

So the default gives a good speed improvement: 18 seconds vs 66

1 Like

Going back to my real project (not the lifecycle example available on Github), I got again the same mistake as before, even after updating the VFI toolkit:

Unrecognized field name "LorenzCurveComment".

Error in EvalFnOnAgentDist_AllStats_FHorz_Case1_PType (line 518)
                    AllStats.(CondlRestnFnNames{rr}).(FnsToEvalNames{ff}).(allstatnames{aa})=tempStatsRestricted.(allstatnames{aa});
                                                                                             ^^^^^^^^^^^^^^^^^^^^^^^^^^^^^^^^^^^^^^
Error in main (line 314)
AllStats=EvalFnOnAgentDist_AllStats_FHorz_Case1_PType(StatDist,Policy,FnsToEval,Params,n_d,n_a,n_z,N_j,N_i,d_grid,a_grid,z_grid_J,simoptions);
         ^^^^^^^^^^^^^^^^^^^^^^^^^^^^^^^^^^^^^^^^^^^^^^^^^^^^^^^^^^^^^^^^^^^^^^^^^^^^^^^^^^^^^^^^^^^^^^^^^^^^^^^^^^^^^^^^^^^^^^^^^^^^^^^^^^^^

I will investigate further and report back

EDIT
I do have a field LorenzCurveComment in StatsFromWeightedGrid

if whichstats(4)>=1
        % Lorenz curve and Gini coefficient
        if npoints>0
            if WeightedSortedValues(1)<0
                AllStats.LorenzCurve=nan(npoints,1);
                AllStats.LorenzCurveComment={'Lorenz curve cannot be calculated as some values are negative'};
                AllStats.Gini=nan;

EvalFnOnAgentDist_AllStats_FHorz_Case1_PType calls StatsFromWeightedGrid, StatsFromWeightedGrid has LorenzCurveComment
I copy here intermediate variables in EvalFnOnAgentDist_AllStats_FHorz_Case1_PType (I am debugging)

CondlRestnFnNames =

  2×1 cell array

    {'sick'   }
    {'healthy'}
FnsToEvalNames =

  7×1 cell array

    {'cons'          }
    {'income'        }
    {'labincome'     }
    {'assets'        }
    {'frac_badhealth'}
    {'taxrev'        }
    {'hours'         }

allstatnames =

  12×1 cell array

    {'Mean'             }
    {'Median'           }
    {'RatioMeanToMedian'}
    {'Variance'         }
    {'StdDeviation'     }
    {'LorenzCurve'      }
    {'Gini'             }
    {'Maximum'          }
    {'Minimum'          }
    {'QuantileCutoffs'  }
    {'QuantileMeans'    }
    {'MoreInequality'   }

tempStatsRestricted = 

  struct with fields:

                 Mean: 1.6892
               Median: 1.4535
    RatioMeanToMedian: 1.1622
             Variance: 1.4663
         StdDeviation: 1.2109
          LorenzCurve: [100×1 gpuArray]
                 Gini: 0.37279
              Maximum: 13.2909
              Minimum: 0.05
      QuantileCutoffs: [21×1 gpuArray]
        QuantileMeans: [20×1 double]
       MoreInequality: [1×1 struct]

Found it! When ff = 2 (loop counter for income), then WeightedSortedValues(1)<0 and tempStatsRestricted has a field called LorenzCurveComment. So the problem is that my variable income has some negative values? This happens because income includes medical expenses, so that income can be negative sometimes.

If the Lorenz curve or the Gini cannot be calculated for a variable with negative values, then the code should maybe return a warning and report a NaN for Lorenz curve and Gini

1 Like

Thanks for figuring out what was happening with “LorenzCurveComment”. I will fix this Monday afternoon.

I will also look more closely at the interp1 error then. I suspect it may be a numerical rounding issue, I had some that needed to be cleaned up in my example so guessing there might be another source of them that occurs in your example but didn’t in what I was using.

[I assume when you say simoptions.agestats you mean simoptions.agegroupings?]

1 Like

Thanks a lot ! I mean simoptions.whichstats

One quick question: if I want to evaluate the functions to evaluate on a grid, can I use the command EvalFnOnAgentDist_ValueOnGrid_Case1? Does it work with finite horizon and permanent types?

Thanks!

if I want to evaluate the functions to evaluate on a grid, can I use the command EvalFnOnAgentDist_ValueOnGrid_Case1?

Yes.

The finite horz version is:
EvalFnOnAgentDist_ValuesOnGrid_FHorz_Case1.m

The finite horz with permanent types version is:
EvalFnOnAgentDist_ValuesOnGrid_FHorz_Case1_PType.m

1 Like

Just pushed something. I think it might have fixed the LorenzCurveComment issue (hard to tell as I don’t have it myself). Let me know.

1 Like

Bsides the Lorenz curve comment, do you get an error if you set

simoptions.whichstats=[1,1,1,2,0,0,0]

?

I tested simoptions.whichstats and it works OK without errors, thanks! Here are the running times, in seconds:

simoptions.whichstats  = [1,1,1,1,0,0,0]; 
Time for age stats: 65.567319 
Time for all stats: 0.782740 
simoptions.whichstats  = [1,1,1,2,0,0,0];
Time for age stats: 10.686478 
EvalFnOnAgentDist_AllStats_FHorz_Case1_PType
Time for all stats: 0.203954 
simoptions.whichstats  = default
Time for age stats: 15.007911 
EvalFnOnAgentDist_AllStats_FHorz_Case1_PType
Time for all stats: 1.023829 

Now the new code is about 6-7 times faster than the old one. I guess the default is simoptions.whichstats = [1,1,1,2,1,1,1];