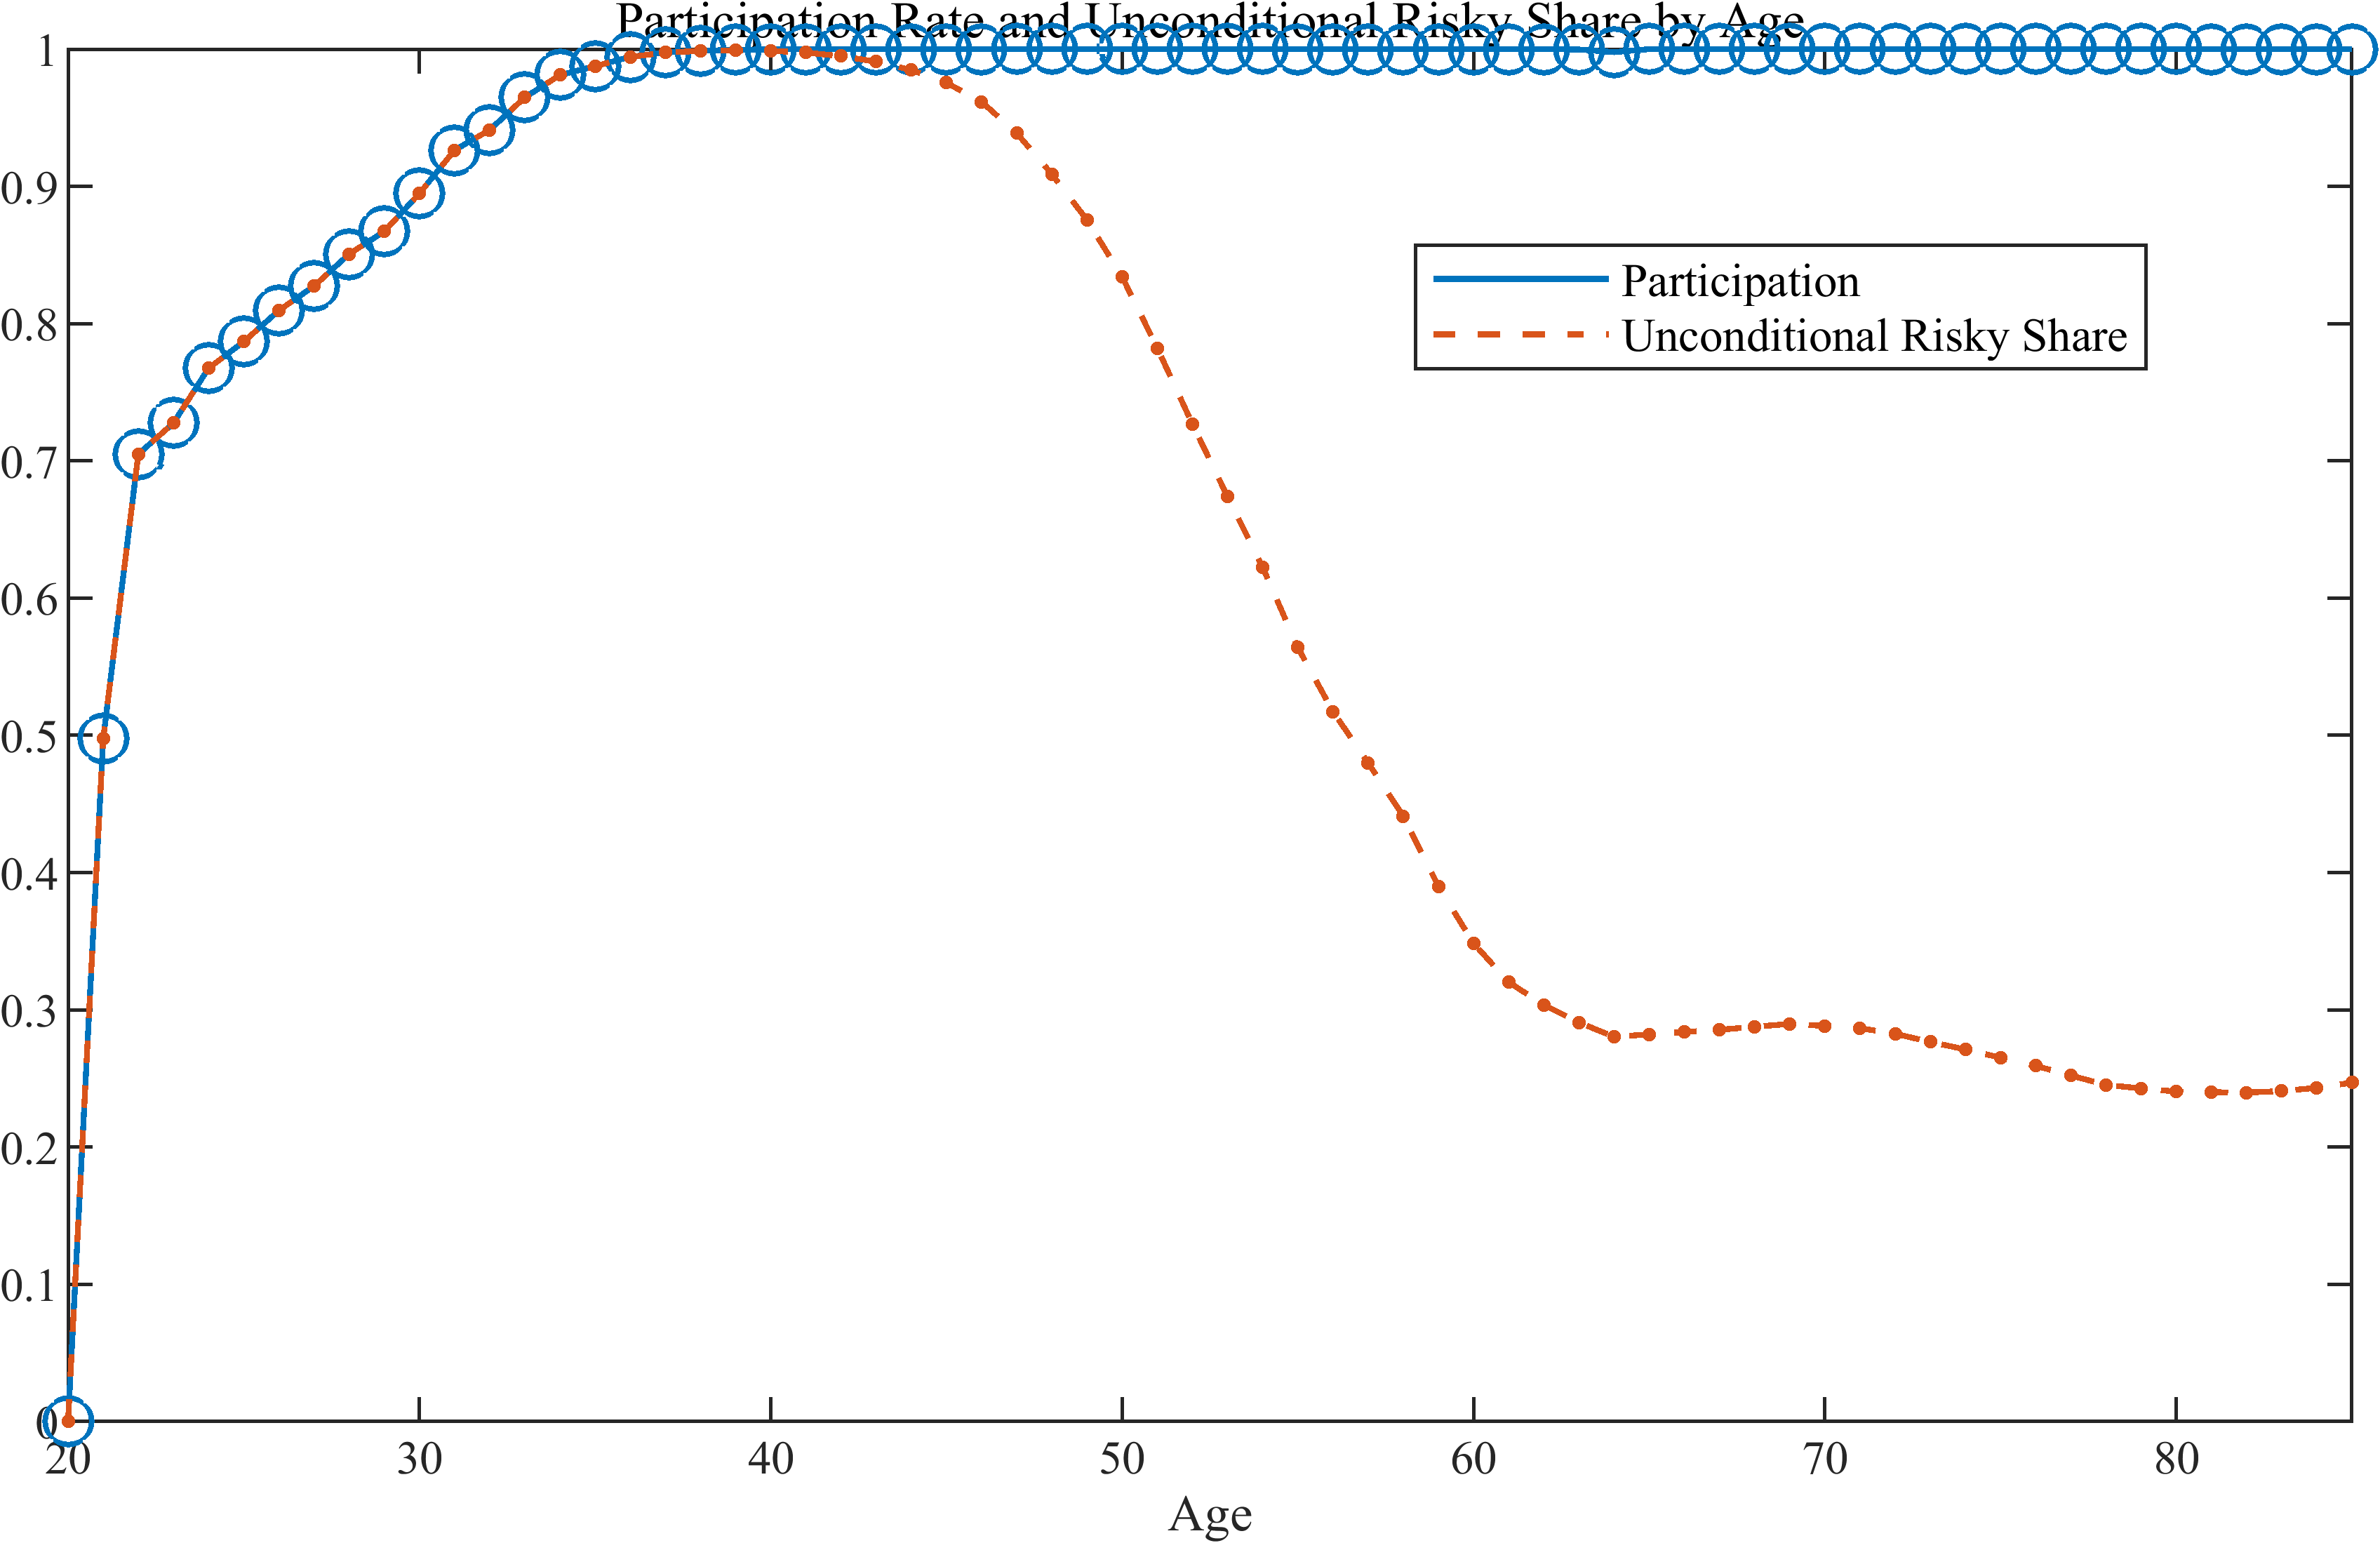
In my research, which is based on your portfolio choice models, I study stock demand measured by the stock market participation rate and the unconditional stock share (i.e., stock holdings in the portfolios of both participants and nonparticipants).
I am unable to understand why the participation rate corresponds exactly to the unconditional stock share for many years at the beginning of the life cycle. Is this a modelling artefact, or does this dynamic have some technical interpretation?
Can you please email me a copy of code that generates this graph so I can take a closer look?
(My guess, everyone who participates during those first few years puts a share of one in the risky asset. This would make participation and risky asset essentially the same. And this lasts just the first few periods. Obviously this is a comment about what is happening in code, not about economic intuition for it. Nor about whether this is ‘correct’)
This does actually seem to be the case. It makes sense both from a technical and economic perspective. Now the interplay between stock market participation, conditional and unconditional stock share is clear to me.
I don’t want to take any more of your time on this particular topic, so there’s no need to look into the code.
I have one or two more issues/questions, but they’re much less critical at this point, so there’s no need to resolve them right away.
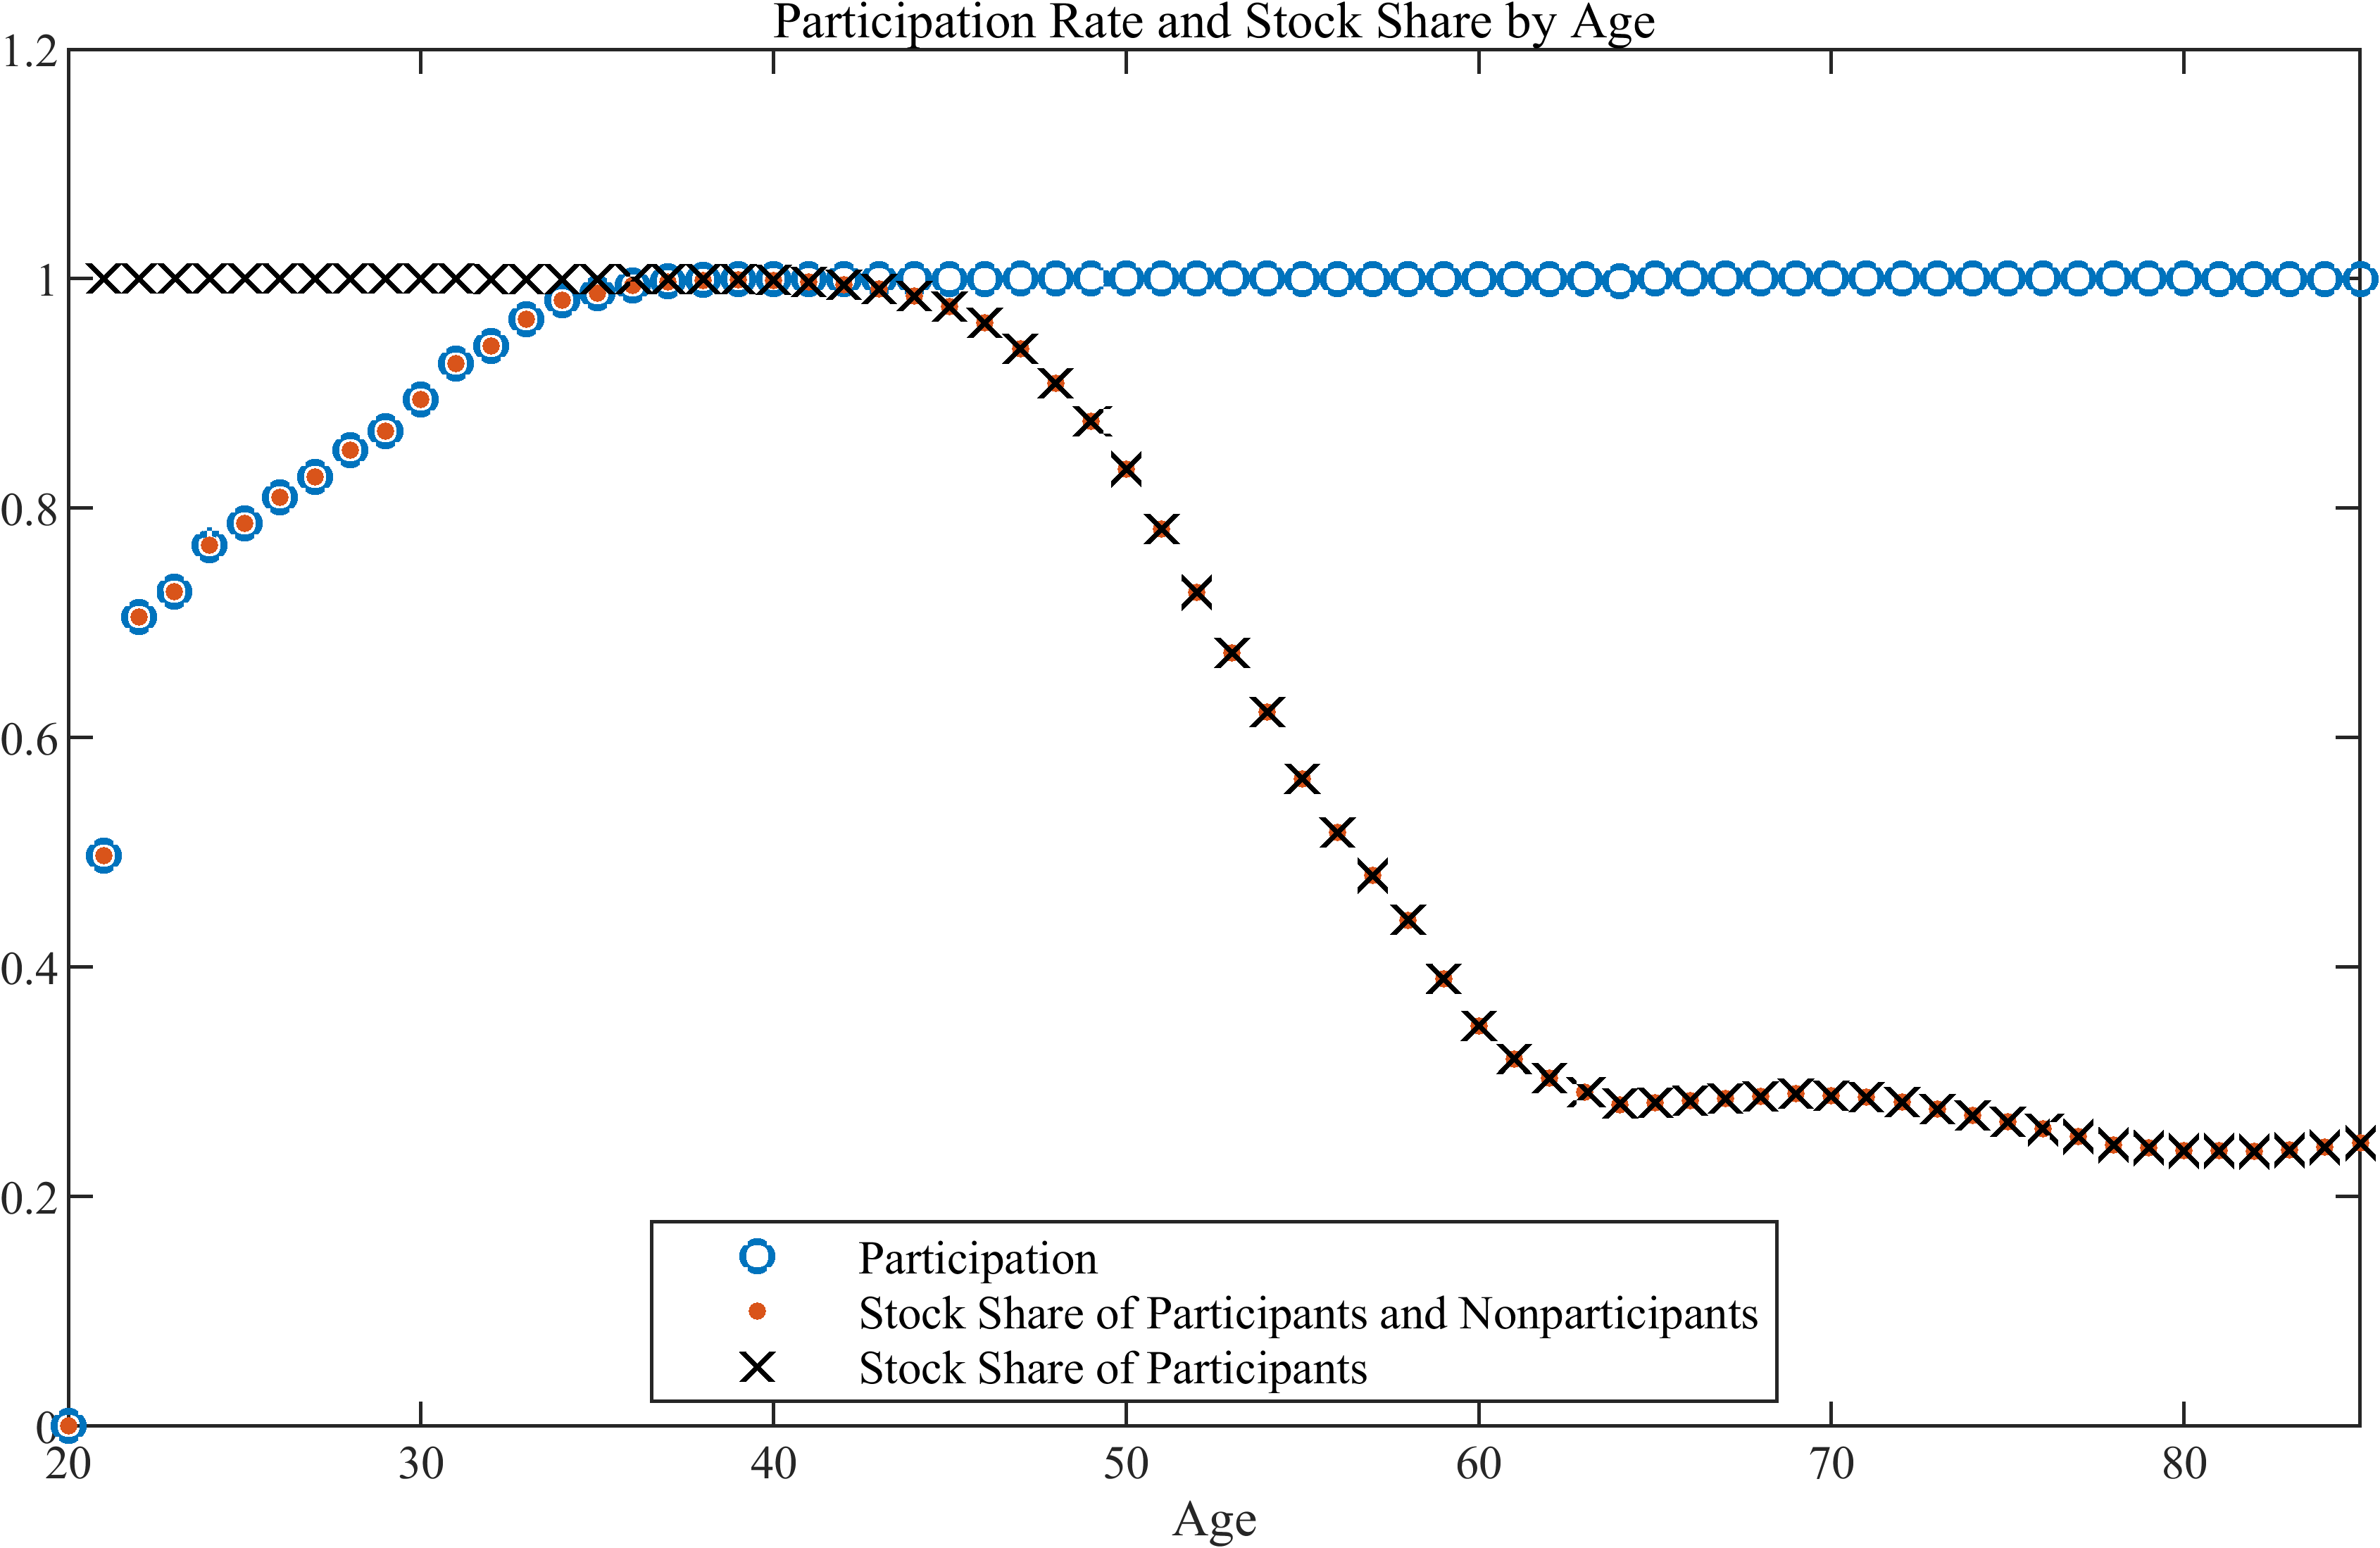
From age 38+: participation rate=1, so the ‘stock share’ will be the same whether if is ‘of Participants and Nonparticipants’ or it is ‘of Participants’ since everyone is anyway a participant.
Pre age 38: same thing as previous post (0 stock share of all nonparticipants, together with 1 stock share of all participants; so stock share across all is just the participation rate).
PS. Rereading your post, I think the graph was a statement confirming/illustrating the ideas of previous post and not a question, but since I’ve already written an answer I am just going to post it anyway
PPS. Less sharp intuition, more just have solved a lot of models over the years so there is little I haven’t seen before