Hi Robert,
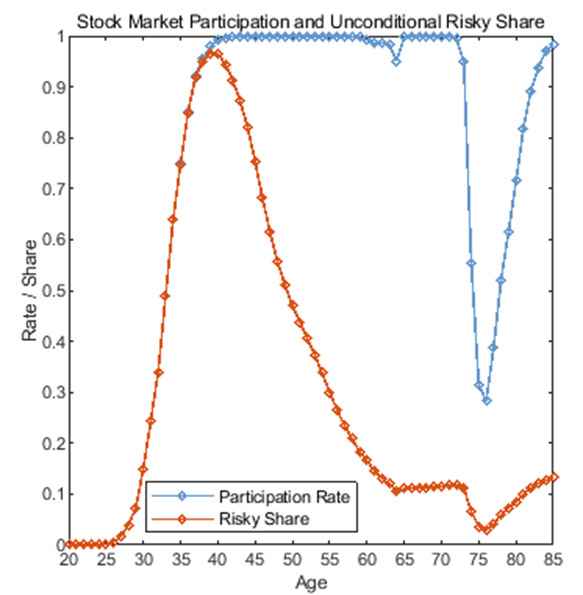
I am struggling with an issue for which I do not have an explanation. I am plotting the unconditional stock share (i.e. the share of stock in the portfolios of all households—participants and non-participants) based on
FnsToEvaluate.riskyshare = @(savings, riskyshare, a, z1, z2, e1, e2) riskyshare
and the stock market participation rate based on
FnsToEvaluate.stockmarketparticpation = @(savings, riskyshare, a, z1, z2, e1, e2) (savings > 0) * (riskyshare > 0)
The issue is that the stock share and participation rate always start with the same dynamic. This seems weird to me, since this does not align with the literature or the data. I’ve pasted two examples below, which use different specifications.
I do not know what is causing this behaviour or how I can solve it. Thank you very much for your help!
P.S. As you can see, I am using the no-refine version because I include the stock market participation cost in the return function (which requires the risky share).
1 Like
Can you please email me your codes so I can run and take a look?
One possibility, your FnsToEvaluate.riskyshare will include people who have zero savings. Maybe do riskyshare conditional on savings>0 (you can use simoptions.conditionalrestriction)
[you could do the same by setting up FnsToEvaluate.riskyshare as riskyshare*(savings>0) and FnsToEvaluate.positivesavings as (savings>0), then just do the riskyshare moment divided by the positivesavings moment (only works if you are only interested in mean, conditionalrestriction gives all the other stats too)]
2 Likes
Sure, I sent you the files. Thank you Robert.
Unfortunately, I am not able to fix issues. 
I am quite confused now because I am additionally not confident whether riskyshare actually measures:
• unconditional riskyshare:
[riskyshare / ((number of stock market nonparticipant) + (number of stock market participant))] or
• conditional risky share:
[riskyshare / (number of stock market participants)].
The case is that unconditional riskyshare should take into account also households who have savings == 0, or those who have savings > 0 but have riskyshare == 0. Therefore, unconditional riskyshare should be quite smaller than the conditional risky share.
I tried to manipulate FnsToEvaluate.riskyshare in many ways in order to untangle unconditional from conditional risky share, but nothing worked. In each case the dynamics of stock share are as they were, or zero if I add too much conditions. I also tried manipulating stock market participation rate in order to clearly distinguish between:
• stock market participation rate,
• unconditional riskyshare and
• conditional riskyshare.
Although I am investigating only stock market participation rate in unconditional riskyshare, it would be great to see the dynamics of conditional riskyshare in order to see the difference relative to unconditional riskyshare.
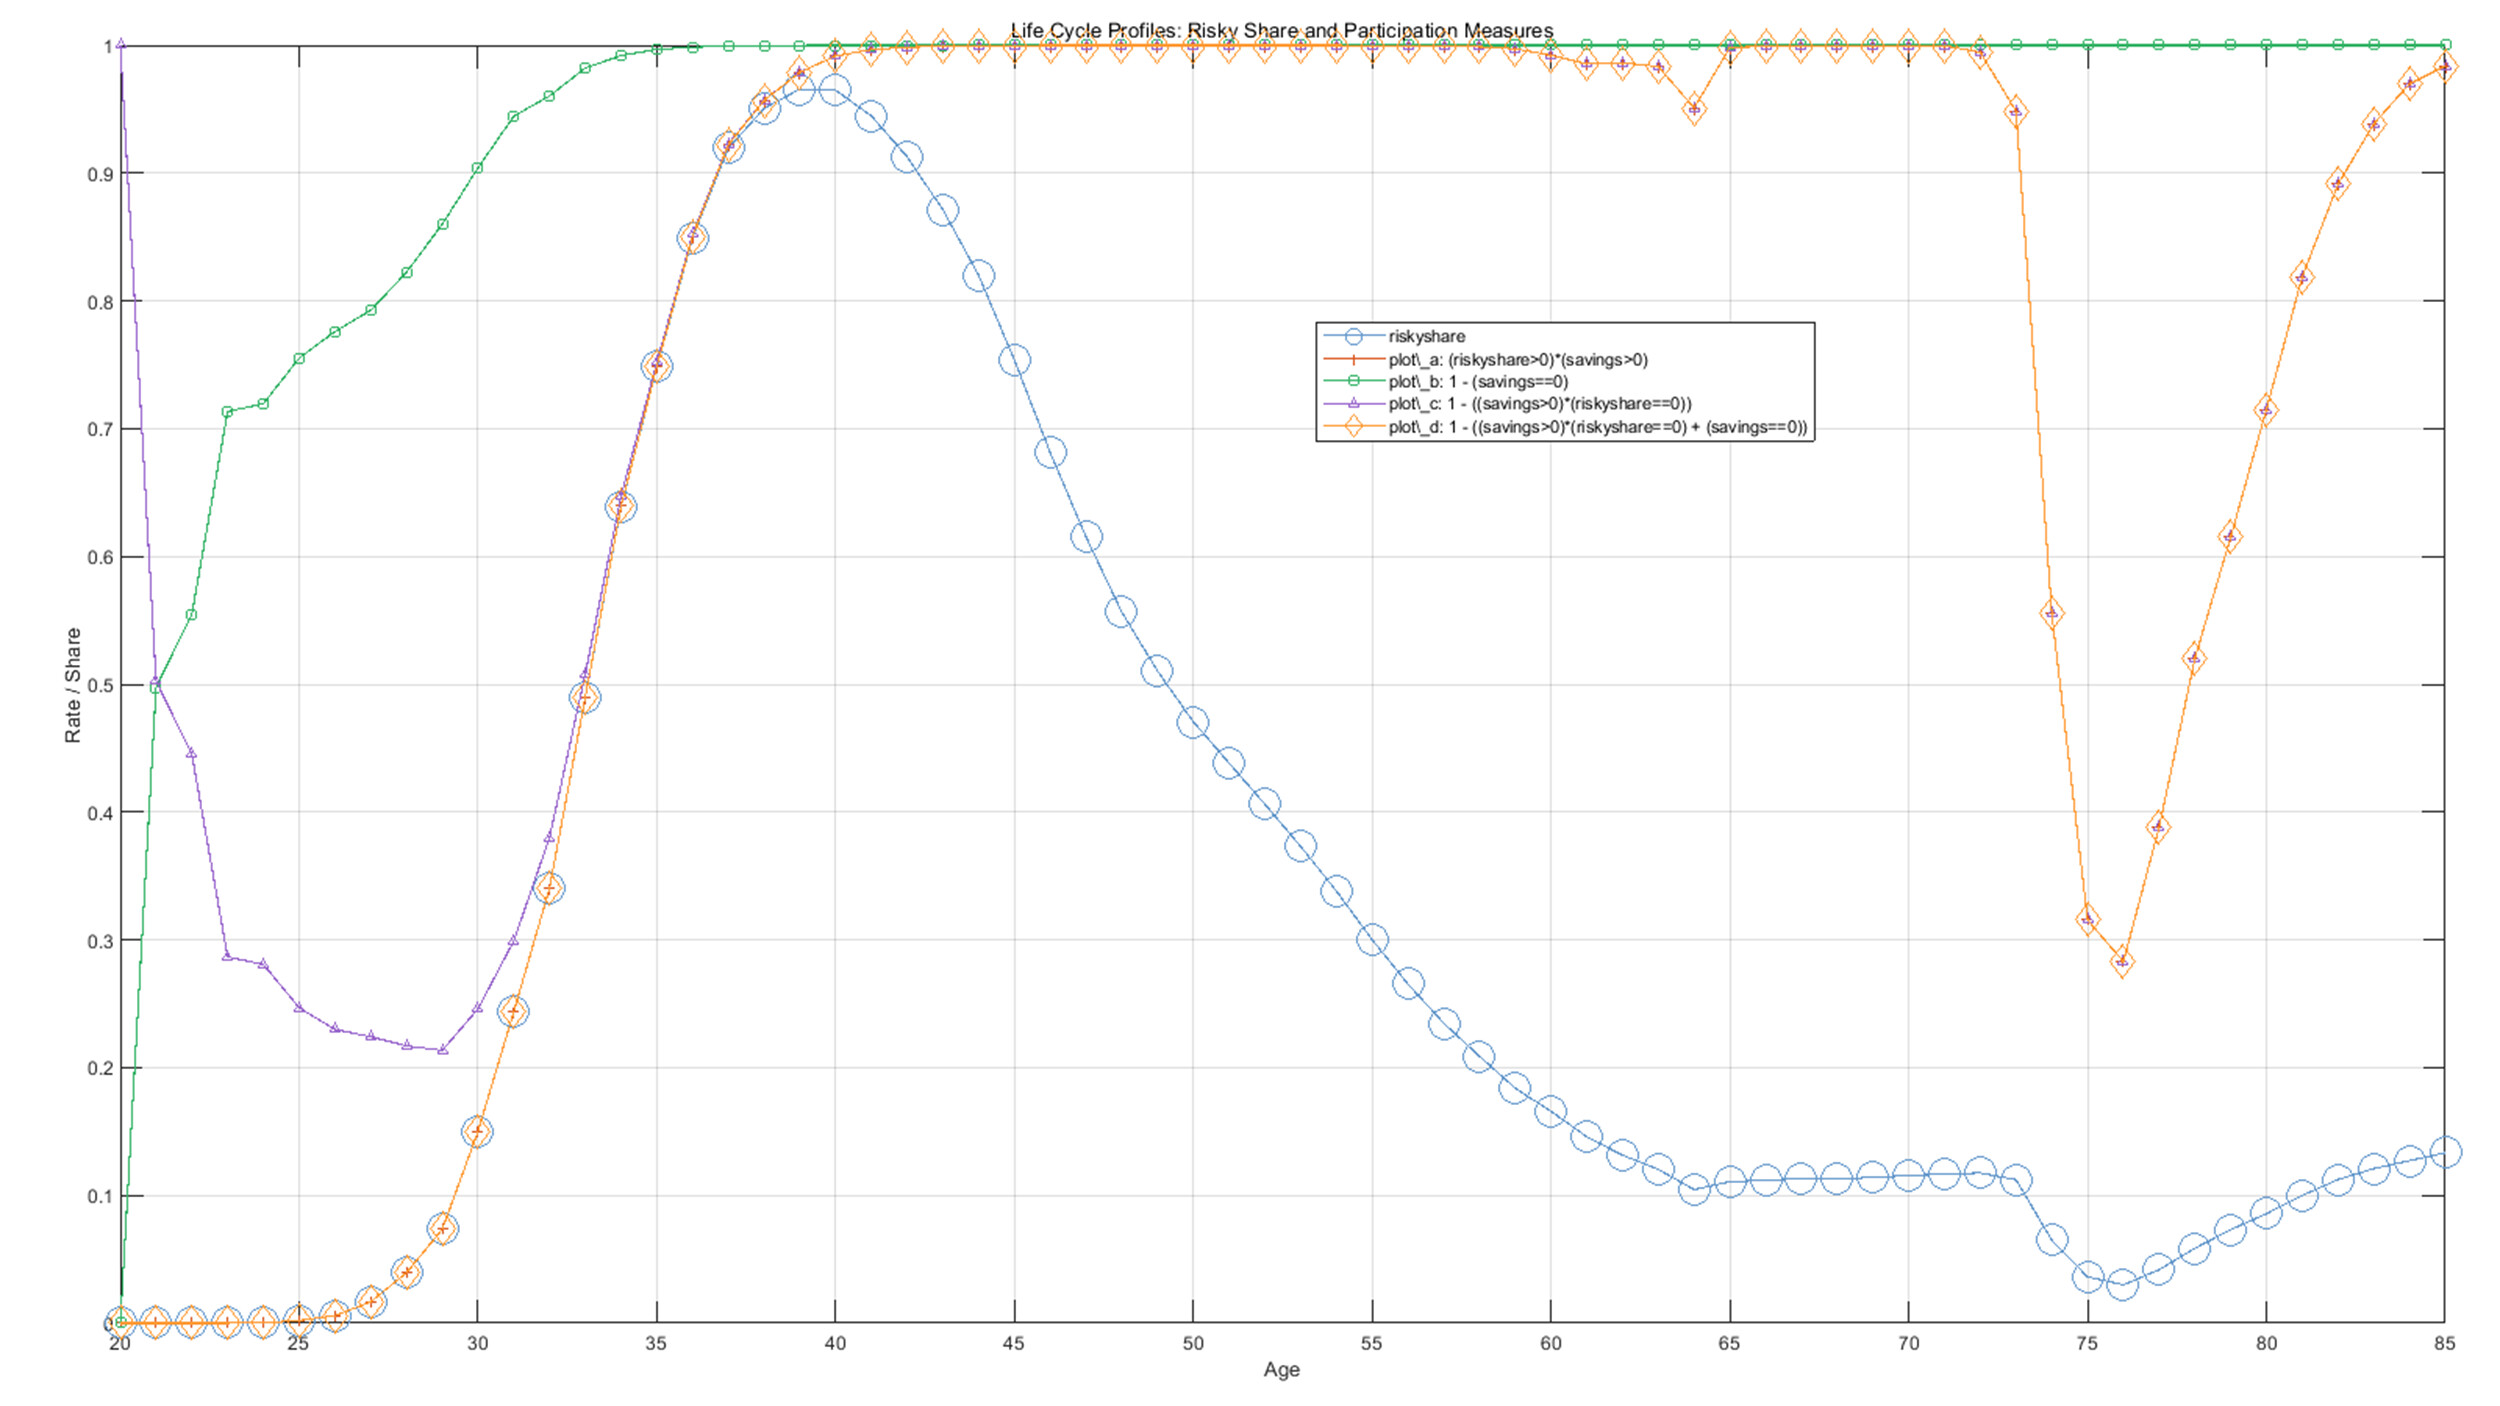
Observation 1:
Is it possible that the stock market participation rate is actually better defined as 1 - ((savings > 0) * (riskyshare == 0)) instead of (riskyshare > 0) * (savings > 0)?
The line with triangles suggests that this might be the case (just my intuition based on specific model settings).
1 Like
Observation 2:
Is it possible that the VFI Toolkit riskyshare actually measures the conditional risky share? If this is the case, then the unconditional risky share can be measured as the product of the conditional risky share and the participation rate. If this holds, then all three relevant categories under discussion are defined.
However, I am not able to compute the product of stock market participation and stock share. I tried
FnsToEvaluate.example = @(...) riskyshare * (1 - ((savings > 0) * (riskyshare > 0)))
or
FnsToEvaluate.example = @(...) riskyshare * ((savings > 0) * (riskyshare > 0)),
but both just give me a life-cycle plot that is exactly the same as the one based on
FnsToEvaluate.example = @(...) riskyshare.
1 Like